Predict customer behaviors to make better decisions
"Wow, this is an Artificial Intelligence Solution we can easily understand and benefit!" - A user
"Wow, this is an Artificial Intelligence Solution we can easily understand and benefit!" - A user
Collect data from all the sources you use with import functionalities or integration capabilities. Data doesn't have to leave your servers.

Unleash the wisdom of data science by AI modeling, predicting customer behaviors, and prescribing remedies for your organization accordingly.
You don't have to be a data scientist to benefit from artificial intelligence. We will help you in every step.
We aren't a faceless corporation. Look, here are our actual faces! We are humble, easy to reach, and good at what we do.


Our pricing is customized based on company size, business complexity and integration details.
We prioritize proving our value through POCs, with monetary considerations taking a back seat.
Broad Street Analytics is bold like ChatGPT. But not generative AI, this is about numbers. So, statistical prediction!
Our AI engine and location-based customer profiler are specifically designed to address adverse selection and moral hazard problems head-on. By leveraging powerful algorithms and data analytics, we empower businesses like yours to make informed decisions and mitigate the risks associated with information asymmetry.
We can help you prescribe your organization:
more precise risk assessment,
offering customized solutions like different risk premiums for different
customer segments,
saying goodbye to guess work and uncertainty caused by information asymmetry

Harness the power of Machine Learning for data-driven insights:
Employing advanced analytics and machine learning empowers organizations to gain
a deeper understanding of customer behavior. Recent studies indicate that
machine learning can lead to a 5% monthly reduction in
churn, revolutionizing company growth over the course of a year.
Effective predictive analytics can identify early indicators of churn, enabling
timely intervention. For instance, analyzing specific customer behaviors can
reveal dissatisfaction, prompting proactive measures to address their concerns.
Use customer feedback results in training AI models:
Feedback loops are instrumental in enhancing products and services. Proactively
utilizing customer feedback to refine services is
crucial. Have you considered incorporating CSAT results into an artificial
intelligence
model?
Optimize Customer Service:
Efficiency is paramount in customer service. Automated assistants expedite issue
detection, resulting in increased customer satisfaction.
Deliver a personalized experience, implement incentives and loyalty
programs:
Understanding hidden customer patterns is pivotal in crafting effective
marketing and campaign strategies. For example, rewarding loyal customers
throughcampaigns like discounts can strengthen customer loyalty. Tailoring
communications and interactions foster loyalty and trust, especially for
customers who are considering to churn.
Ensure competitive pricing and foster product innovation:
Maintaining competitive pricing is essential to stay appealing to both
existing and new customers. This is critical for attracting and retaining
customer
loyalty. Broad Street Analytics can assist in determining the right pricing
policy by
leveraging the power of AI.
Broad Street Analytics will lead you to gain new customers while keeping the current ones happy and satisfied.

People as individuals are very special, but people as part of groups are not so much. They are similar.
There are several ways for classifying your customers such as demographics, behavioral, psychographical, geographical etc. However, it's not very simple to pick which for which circumstances. Or should you pick a combination of two? Broad Street Analytics AI models will identify patterns for you.
Once customer segmentation is provided accurately, you as a company can decide
which segment to target,
how to tailor your products and services,
how to communicate with the audience,
where to share your messages,
and possibly more...
Broad Street Analytics helps you clustering customers in the most effective way
based on your company goals.

How are your sales going to be effected when you change your marketing
strategy?
Predictive analytics merges current and/or past data, predictive modeling, and machine learning to anticipate specific events and outcomes. In contrast, descriptive analytics works on historical data to comprehend the factors and anomalies influencing performance. While descriptive analytics focuses on the past, predictive analytics is geared toward anticipating future developments.
Make data-driven, better-informed decisions and more accurate budget allocation.
Forecast trends and trend shifts. Also, their impact on your revenue.
Optimize your marketing strategy to lead more sales.
Broad Street Analytics helps you understanding the impact of your marketing
decisions on revenue and sales.

Sales prediction:
Sales prediction, commonly known as sales forecasting, involves the process of
projecting future sales by estimating the quantity of products or services that
an individual salesperson, a sales team, or a company is expected to sell within
a defined time period, such as the upcoming week, month, quarter, or year.
A sales forecast is instrumental for guiding businesses in making informed decisions. It plays a crucial role in comprehensive business planning, budgeting, and risk management. Through sales forecasting, companies can strategically allocate resources for future growth and adeptly manage their cash flow.
Insurance claim prediction:
According to Willis Towers, more than two-thirds of insurance firms
state that predictive analytics
has played a crucial role in lowering their expenses and addressing underwriting
challenges. The surge in
Artificial Intelligence has led insurance companies to increasingly embrace
machine learning for pivotal
objectives such as reducing costs, refining underwriting processes, and
enhancing fraud detection.
Specifically, through the utilization of machine learning, insurers can
efficiently screen cases,
assess them with exceptional accuracy, and make precise cost predictions.
To emphasize the significance of integrating machine learning, McKinsey estimates that German insurers alone could save approximately 500 million Euros annually by incorporating machine learning systems into healthcare insurance. This statistic underscores the compelling need for insurance companies to adopt machine learning methodologies.
Broad Street Analytics will fast forward the time for you to help calculating your cash flow and/or taking other data-driven decisions.

The global average rate of losses caused by fraud for the last two decades represents 6.05% of the gross domestic product. Additionally, companies have reported that cyber breaches have caused financial damages equaling 3% to 10% of their revenue. Moreover, global digital fraud losses are projected to exceed $343 billion between 2023 and 2027.
Given the estimated amounts, it is a crucial question for any organization to build up an efficient fraud management system. Fraud management is identifying, preventing, detecting and responding to fraudulent activities within an organization.
Artificial intelligence (AI) has a significant role in fraud management. AI technologies, such as machine learning (ML) algorithms, can analyze large amounts of data and detect patterns and anomalies that may indicate fraudulent activities. AI-powered fraud management systems can identify and prevent various types of fraud, such as payment fraud, identity theft or phishing attacks. They can also adapt and learn from new fraud patterns and trends, improving their detection over time.
AI-based solutions can also integrate with other security systems, such as identity verification and biometric authentication, to provide a more comprehensive approach to fraud prevention.
Reference: How can artificial intelligence help detect fraud?
Broad Street Analytics helps banks and insurance companies identifying transaction frauds, illegal payments and identity thefts.

AI and AML have significant crossover — both rely on patterns in what are often very layered data sets. In AML, important patterns in variables can include frequency, size, and location of deposits, as well as jurisdictions of companies, controllers, owners, and politically exposed persons (PEPs). Machine learning is well-equipped to unearth the buried nexus points between the variables.
In the current economic landscape, where banks and financial institutions are keen on tightening operational expenses, areas heavily reliant on manpower, such as AML and compliance, undergo close examination. Simultaneously, these entities grapple with increasingly stringent and dynamic regulations.
CFOs are actively seeking cost-effective approaches to enhance programs and achieve more with less. While strategies like off-shoring and relocating teams to tax-friendly states contribute to cost reduction, automation emerges as the ultimate frontier in this pursuit.
Broad Street Analytics helps banks and insurance companies train AI models for AML, and readily available location based demographics database will go a long way in your trainings for sure.

One of the most popular and modern maintenance policies is Predictive Maintenance (PdM), which is also known as condition-based maintenance. PdM measures parameters in the condition of equipment in order to carry out the appropriate tasks to optimize the service life of machines and processes without increasing the risk of failure.
PdM as a term is mostly used for equipment related maintenance strategies which
excels in
Preventing imminent and unexpected equipment failure,
Reducing the total time spent in maintenance,
Reducing maintenance costs by avoiding catastrophic defects,
Increasing availability and reliability of your equipment,
Extending life of equipment and processes,
and possibly more...
Broad Street Analytics helps you reducing equipment failures for higher customer satisfaction and reduce your maintenance costs.

In the recent era, for most sustainable smart cities energy conservation is a major point of consideration as urbanization is been carried out at an exponential rate. Out of that most of the energy consumption is diverted toward households, and there is a huge scope for optimization of this energy. Hence predicting this household energy with the advancement of AI and Machine Learning techniques is considered a social contribution and area of interest for most researchers. But only predicting the energy consumption will not solve the problem of energy optimization for a city, it is also important to understand the factors responsible for such predictions so that all possible recourses could be carried out to those factors, and it becomes more accountable, trustworthy and justifiable its energy optimization decisions towards its all stakeholders.
Reference: Explainable AI for predicting daily household energy usages
Broad Street Analytics helps energy companies predicting monthly electricity consumption of households in addition to energy optimization suggestions for your customers, customer segmentation and predictive marketing for your company.

One of the main applications of AI for stock optimization is demand forecasting, which is the process of predicting future customer demand based on historical data, market trends, and other factors. AI can use machine learning algorithms to analyze various data sources, such as sales records, customer behavior, weather, seasonality, promotions, and more, and generate accurate and timely forecasts that can help businesses plan their stock levels and replenishment strategies. AI can also adjust the forecasts dynamically based on real-time data and feedback, and account for uncertainty and variability in demand.
Another application of AI for stock optimization is stock allocation, which is the process of distributing the available stock across different locations, channels, and products to maximize customer satisfaction and profitability. AI can use optimization algorithms to find the optimal allocation of stock that minimizes costs, such as holding costs, ordering costs, transportation costs, and stockout costs, and maximizes benefits, such as revenue, service level, and customer loyalty. AI can also consider various constraints, such as capacity, lead time, demand, and stock policies, and provide recommendations or solutions that can help businesses optimize their stock allocation.
Reference: What are the challenges and benefits of using AI for inventory optimization?
Broad Street Analytics runs simulations to fast forward time to your company's future to tell you about future stocks, products and services in demand, and help you allocating your resources, deciding lead time etc.

Name of "Broad Street Analytics" was inspired from Dr. John Snow and his study during 1850's about cholera outbreak in London. One of the most powerful examples of astute data visualization eventually leading to the establishment of causality dates back more than 150 years. It was not yet known that germs cause disease and cholera was among the most feared. The disease arrived suddenly and was almost immediately deadly: people died within a day or two of contacting it, hundreds could die in a week, and the total death toll in a single wave could reach tens of thousands. The leading theory was that "miasmas" were the main culprit. Miasmas manifested themselves as bad smells, and were thought to be invisible poisonous particles arising out of decaying matter.
Dr. Snow had noticed that the onset of the disease almost always involved vomiting and diarrhea. He therefore believed that the infection was carried by something people ate or drank, not by the air that they breathed.
At the end of August 1854, cholera struck in the overcrowded Soho district of London. As the deaths mounted, Snow recorded them diligently, using a method that went on to become standard in the study of how diseases spread: he drew a map. On a street map of the district, he recorded the location of each death.
You can see Snow's original map above. Each black bar represents one death. When there are multiple deaths at the same address, the bars corresponding to those deaths are stacked on top of each other. The black discs mark the locations of water pumps. The map displays a striking revelation—the deaths are roughly clustered around the Broad Street and its water pump. Although association and causality are two different things in science, noticing this association was the first hint. He later discovered sewage water had been contaminating some parts of River Thames, hence, drinking water which had been supplied by Broad Street pump.
Reference and more details: Computational and Inferential Thinking
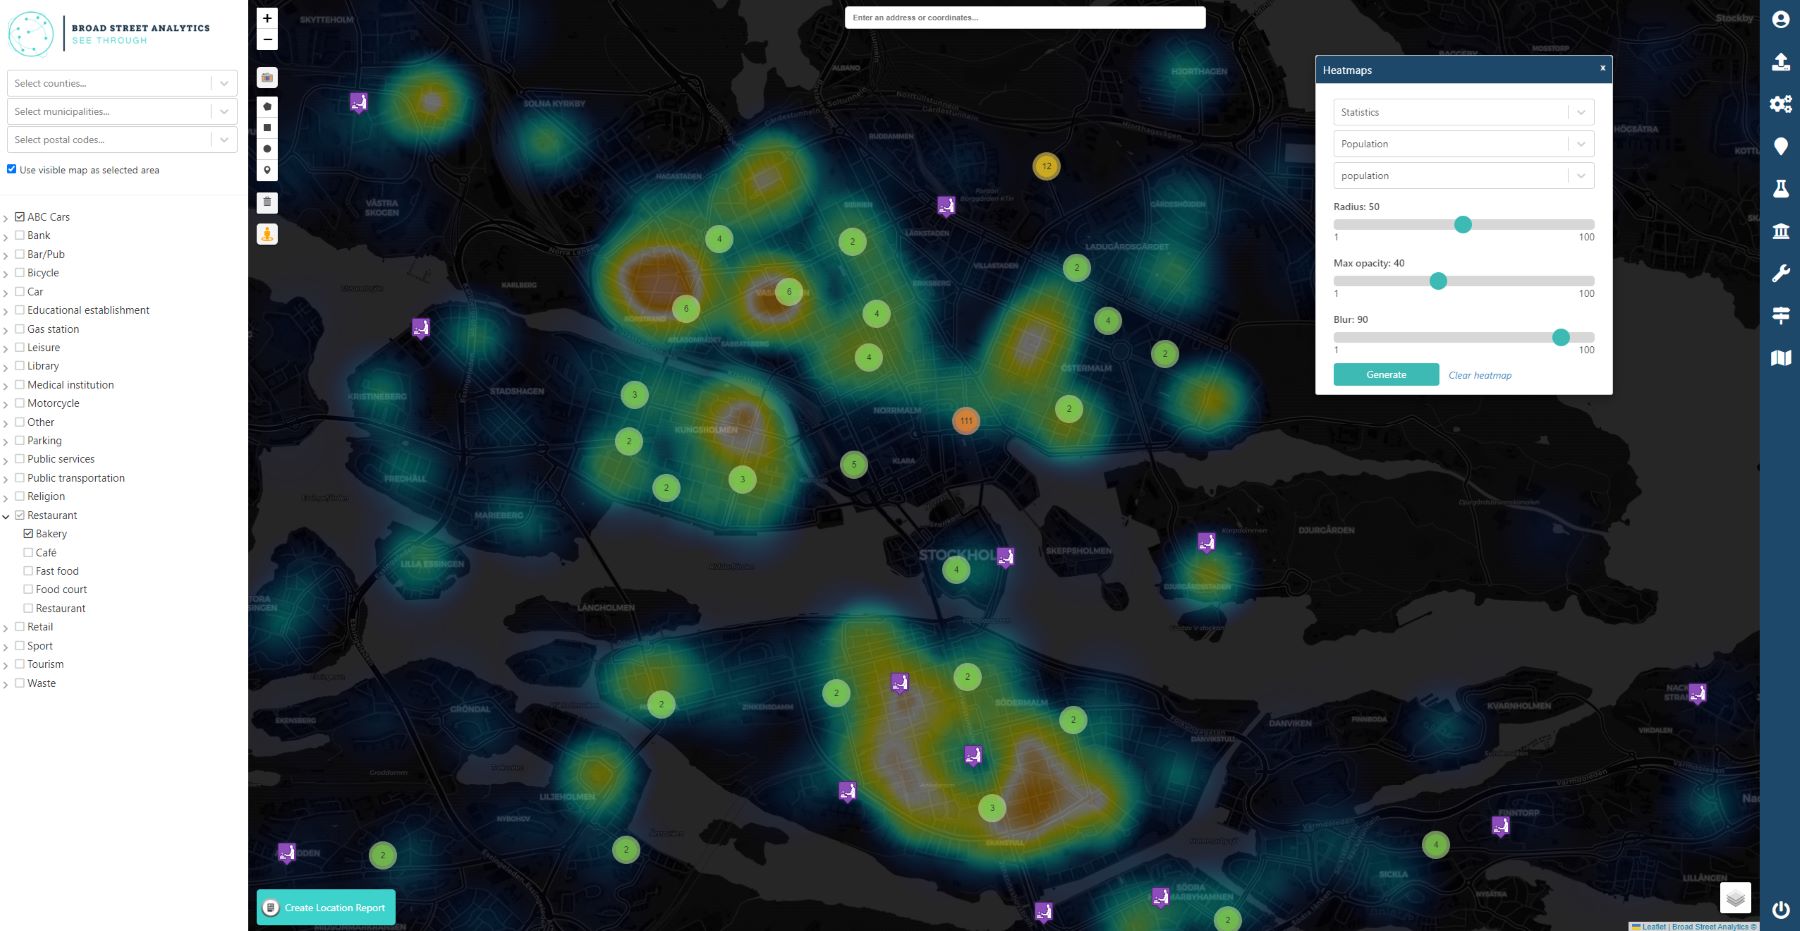
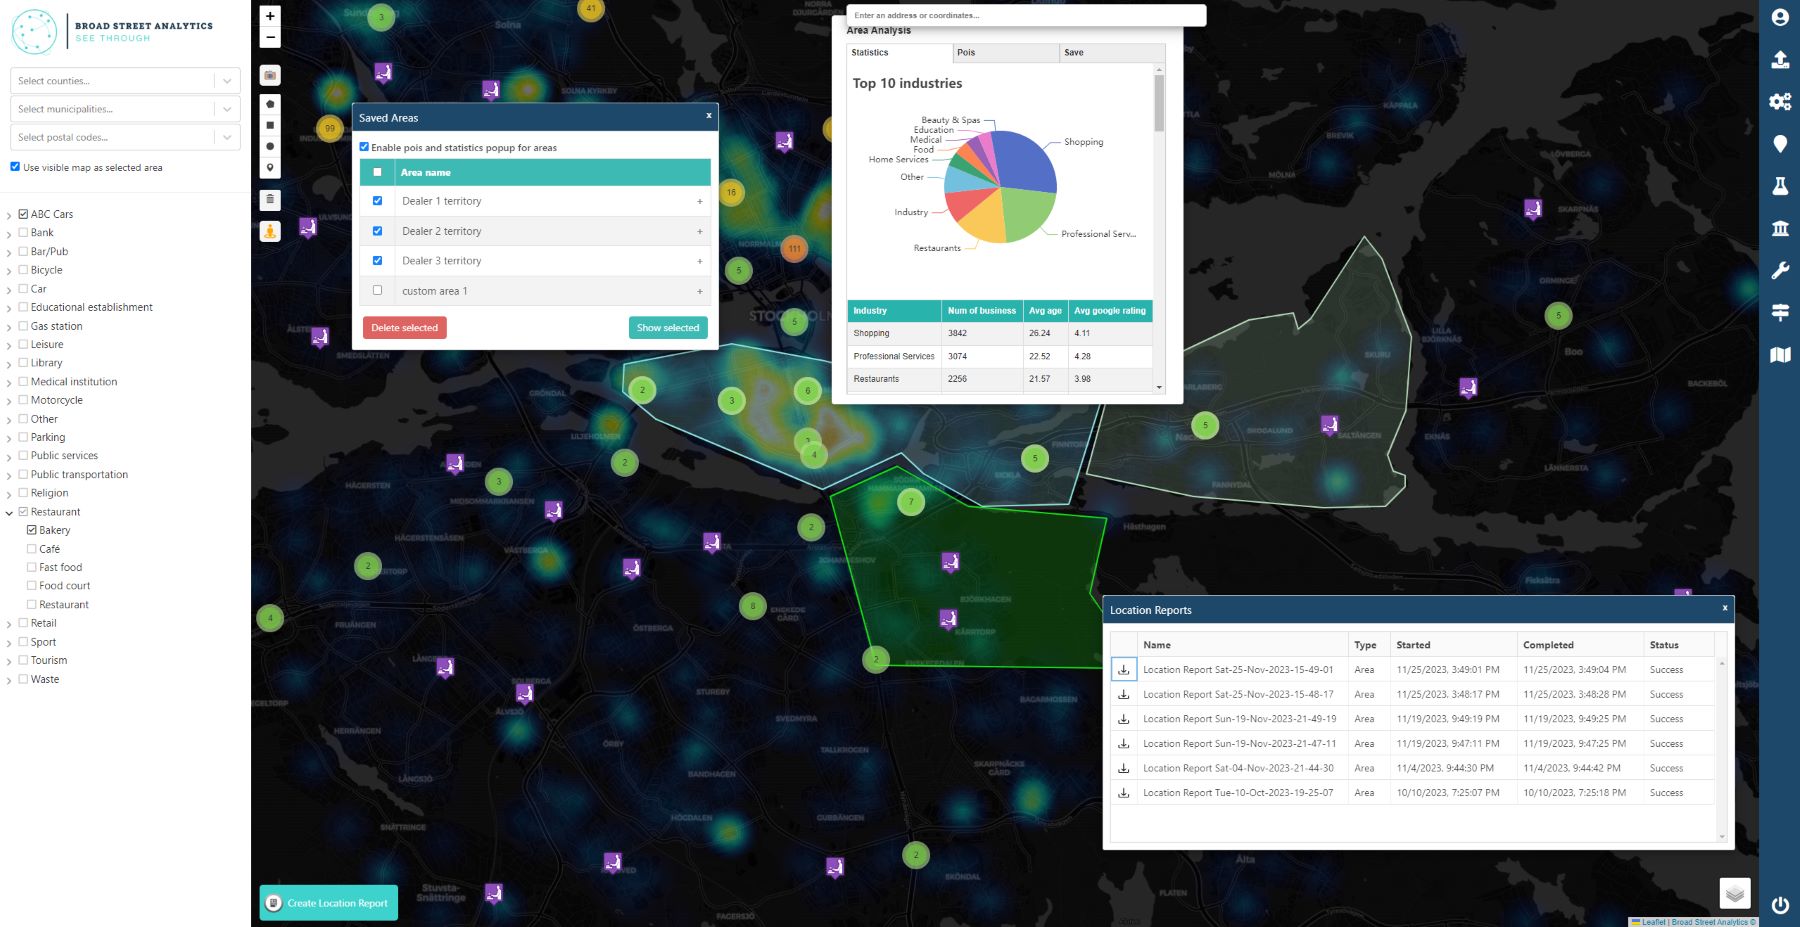
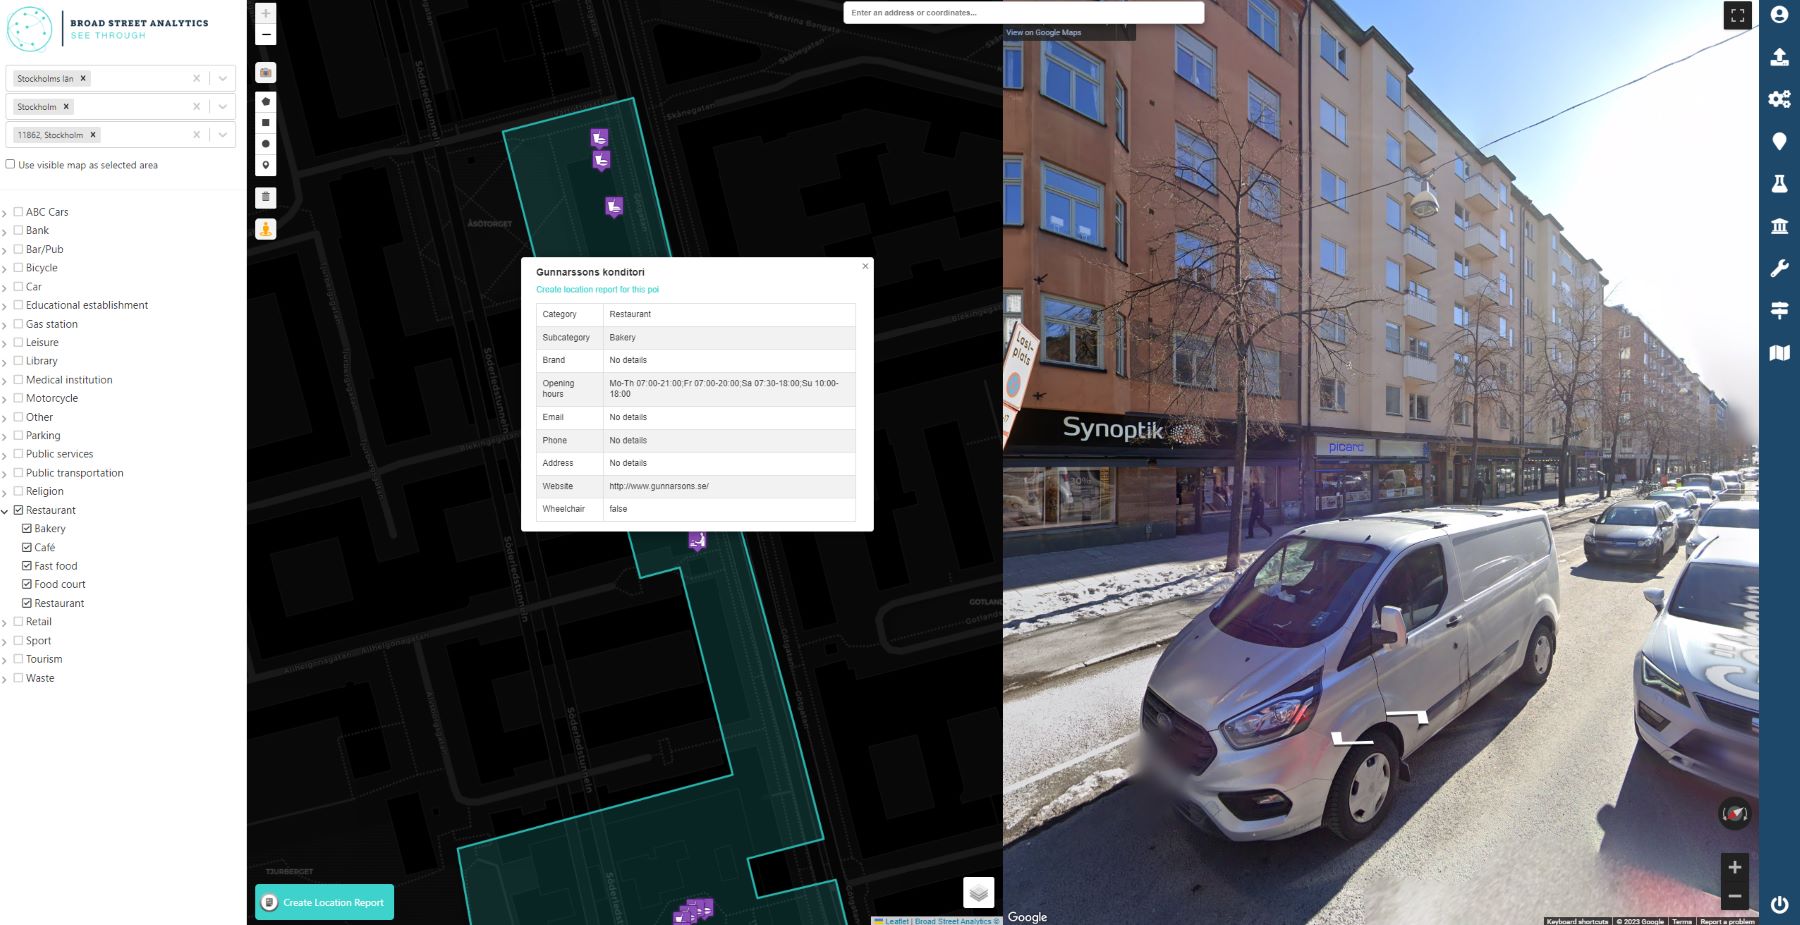
In addition, you will also get access to our statistics database which contains ~350k locations in Sweden and demographics data in postalcode level.


Broad Street Analytics is here to help!
You don't have to be a data scientist to benefit
from data science. If you are a potential client or looking for
partnership or just curious, let's talk!